In this week’s book, Flush by Carl Hiaasen, Noah fought to keep the water from being polluted. We can help with water pollution too! This week’s activity comes to us from my fabulous little sister Hope Braithwaite, who is the Programs Assistant at the Utah State University Water Quality Extension. So she’s an expert on teaching kids about keeping water clean! Take it away, Hope! 🙂
In this activity, we’ll evaluate the quality of a “water sample” (a bag of skittles), graph the results, and form a hypothesis about what was happening on the land near where the sample was taken.
MATERIALS:
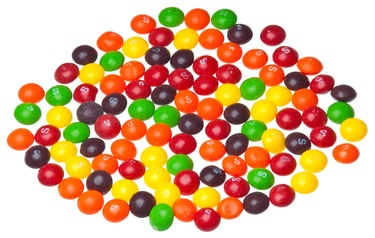
- Candy (we used Skittles)
- Plastic sandwich bags
- Graph paper
- Colored pencils or crayons
Divide the candy into sandwich bags so that the assortment of candy represents a particular land use (see graph below).
Each color of skittle represents a different kind of pollutant.
- PURPLE = Sediment
- RED = Pesticides
- GREEN = Fertilizers
- YELLOW = Oil and Gas
- ORANGE = Toxic Waste
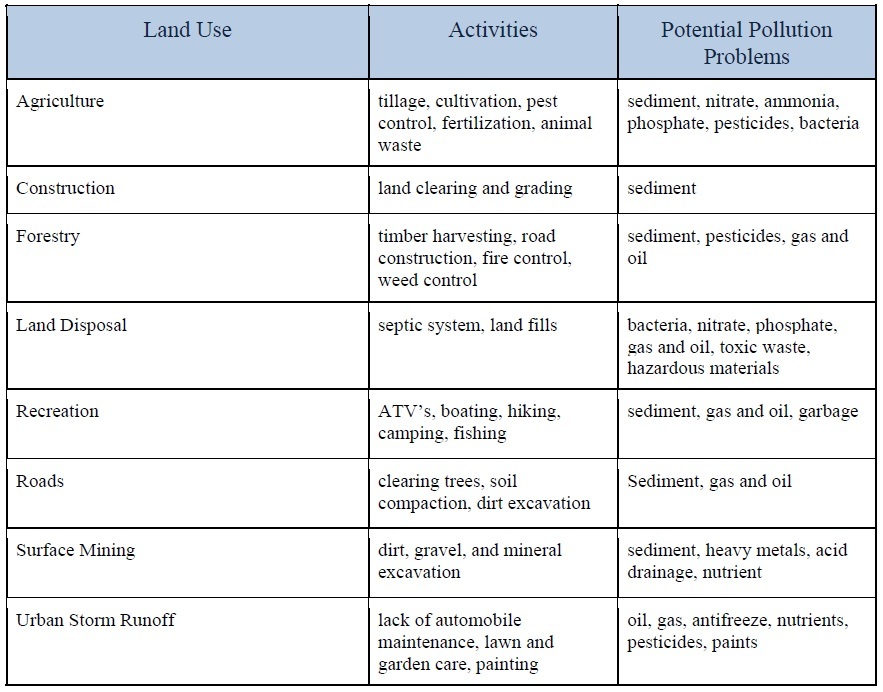
Talk about pollution using the table as a guide. Where does each pollutant come from? What can they be used for? How can they be beneficial? How can they be harmful? Which kind of land uses do you think would cause each type of pollution?
For example, fertilizer may be one pollutant that comes from an agricultural field. Fertilizers are used to help plants grow. They can be beneficial by providing plants we like to eat get the nutrients they need to grow. Excess of these nutrients in streams and rivers can be harmful. They can cause excessive plant growth and when these plants die more oxygen may be used than can be replaced. Without enough oxygen fish and water bugs will die. Also, certain types of microscopic algae can be toxic if they reach high concentrations. Animals like dogs or livestock that drink from this toxic water can become sick or die.
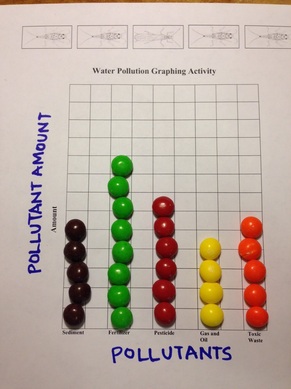
Now it’s time to analyze your “water sample” (bag of Skittles)! Have your kids separate and count the number of each pollutant and record it on a bar graph to show the number of pollutants in the “water sample”. Write the different pollutant types across the bottom of the page (on the x-axis) and write “pollutant amount” down the left side of the page (on the y-axis).
Analyze the “water sample” with each kid. Ask them where they think each sample came from and how they came to that conclusion. Discuss how to reduce pollution as a community and in your own home. Here are some tips:
In the community:
- Encourage friends and neighbors to recycle
- Plan a science fair project about water quality and reducing pollution
- Pick up trash in your neighborhood
In the home:
- Fix leaky cars
- Use less fertilizers and pesticides
- Recycle items at home
- Do not dump oil, gas, or other pollutants in the storm drains
Thanks so much, Hope! Bonus points for anyone who can guess what Hope’s favorite candy is. 🙂 (She likes Reese’s too, but they didn’t fit the activity as well.)
This lesson was adapted from Water Pollution Graphing by Utah State University Water Quality Extension. For the full lesson go to https://extension.usu.edu/files/publications/publication/NR_WQ_2005-07.pdf. For more water related activities and information visit http://extension.usu.edu/waterquality/. They have some really great ones, so go check it out!